
01 · FROM ORBIT
Observe the living Earth
NISAR radar measures changing surfaces through day and night.
 KUNTAU TERRAPULSE
A focused Earth-observation studio for comparing real NISAR radar measurements and investigating changes around river corridors.
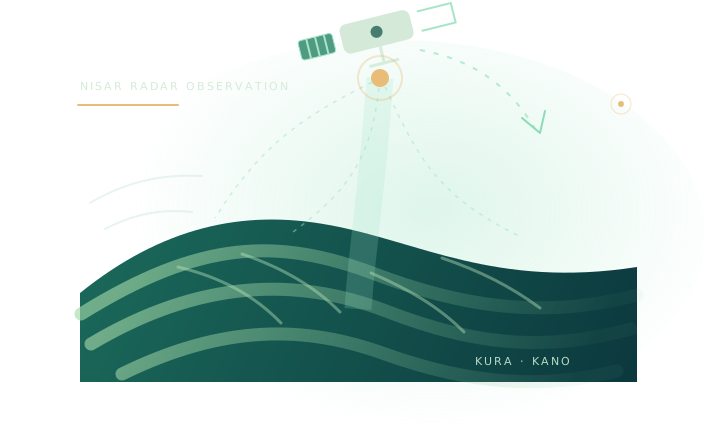
NISAR radar measures changing surfaces through day and night.

Compare radar responses around channels and floodplains, then verify on the ground.

Give communities and response teams clearer places to check after changing conditions.
Select the original October 8 and October 20 GeoTIFFs. They are read locally; nothing is uploaded to a server.
Radar backscatter can respond to water, wet soil, vegetation, surface roughness and acquisition conditions. A change alone does not prove flooding.
The October products are SHSH and DHDH. We will flag this when assessing comparability.
Locate the Kura test footprint and inspect any locally loaded NISAR observation.
Load the original NISAR GeoTIFFs from your computer. This browser reads them locally.
The October 8 scene is SHSH (HH single-polarization); October 20 is DHDH (HH/HV dual-polarization). We use the shared HHHH measurement layer, but the different acquisition modes must be considered before interpreting differences.
Load both original GeoTIFFs. The app will check their grids before calculating a pixel-wise difference.
A radar measurement can reveal surface change. It cannot, by itself, measure river depth, flow rate or water level.
Load both original observations in Compare. The app will then show measurement summaries and clearly separate measured differences from possible river or floodplain explanations.
GCOV provides calibrated, terrain-corrected radar covariance measurements. The values respond to surface and structural properties, moisture, geometry and other factors.
NISAR GCOV guide ↗Changes can be associated with open water, wet soil, floodplain vegetation, roughness or acquisition conditions. Independent evidence is needed to distinguish them.
Do not infer river depth, flow speed, water level or future flood risk from this two-date radar comparison alone.
For stronger interpretation, combine radar with river-gauge readings, rainfall records, flood reports, field photographs and community observations.
Product identifiers, processing context and limitations belong alongside every map. Download this catalogue now; file-specific statistics are added after the GeoTIFFs load.
Choose how KUNTAU TERRAPULSE looks and behaves on this device.
Your choice is saved in this browser and stays local to this device.
The app reads the GeoTIFF files you select inside Chrome. It does not automatically upload them to a server. Refreshing the page clears the current in-memory raster session, so keep your original files safe.
Show the five welcome screens again, including the project story and how the comparison works.
These are illustrative editorial images, not the Kura GeoTIFF observations and not evidence of conditions inside the test AOI.
NISAR orbit visual: NASA Scientific Visualization Studio, “NISAR satellite orbit”.
Nigerian farmland: Abeltrust / Wikimedia Commons · CC BY-SA 4.0.
Nigerian field photograph: mk_photoz / Pexels · Free to use.
KUNTAU TERRAPULSE is a KUNTAU Science Academy project for the NASA Space Apps Challenge 2026 challenge “Dancing with the SARs”. It explores how NISAR radar observations can help people investigate surface change around river corridors and floodplains. This prototype does not predict floods or measure river levels.
This is an evidence-workspace prototype. An analysis preview is not a validated flood or water-extent assessment.
KUNTAU TERRAPULSERiver and floodplain landscapes in NigeriaExplore Earth through radar observations and understand how landscapes change over time.